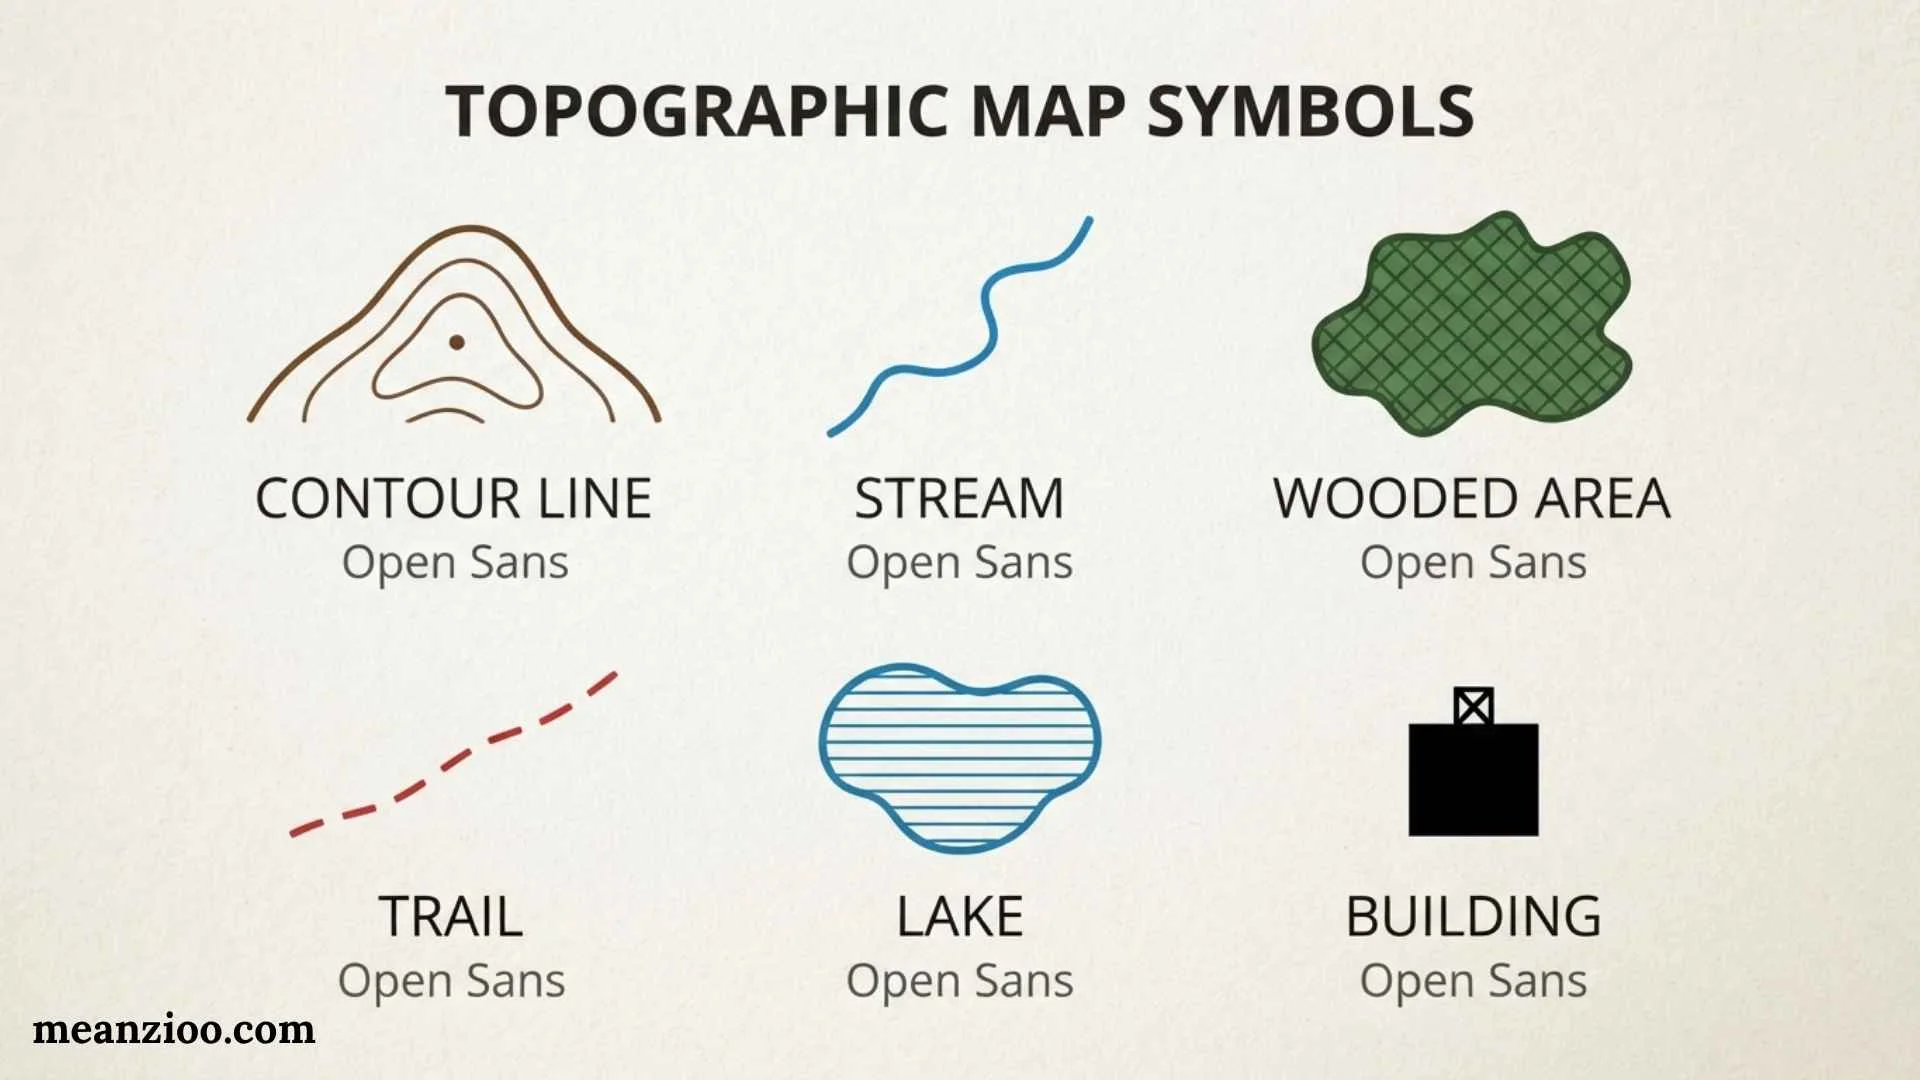
Topographic map symbols are the visual language used to show natural and human-made features on a map. Instead of drawing every road, river, building, forest, hill, or boundary exactly as it appears in the real world, cartographers use standardized lines, colors, shapes, and patterns to represent them.
Learning these symbols makes a topographic map much easier to read. They can help hikers understand terrain, students study geography, surveyors interpret land features, and outdoor enthusiasts plan routes. The most important part of reading any map is remembering that symbols can vary by mapping agency and map type, so the legend should always be checked.
This guide explains common topographic map symbols, map colors, contour lines, elevation, roads, water features, vegetation, boundaries, structures, navigation symbols, and practical ways to read a topographic map accurately.
What Are Topographic Map Symbols?
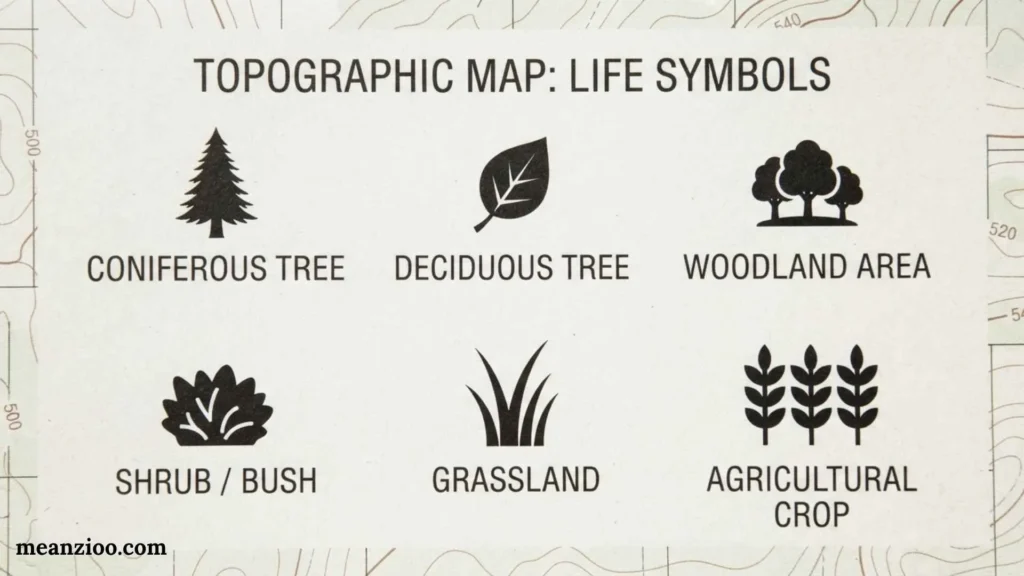
Topographic map symbols are graphic representations of features found on or near Earth’s surface.
These features can be natural or human-made.
Natural features include:
- Mountains
- Hills
- Valleys
- Rivers
- Lakes
- Streams
- Forests
- Marshes
- Cliffs
- Springs
Human-made features include:
- Roads
- Buildings
- Bridges
- Railroads
- Dams
- Power lines
- Pipelines
- Airports
- Cemeteries
- Boundaries
A map may represent a feature with a line, point, area, color, or special pattern. The symbol’s meaning is explained by the map legend.
Why Are Topographic Map Symbols Important?
A topographic map can contain hundreds of geographic details. Writing the name or description of every feature would make the map difficult to use.
Symbols solve this problem by providing information in a compact visual form.
For example, a map can show a stream with a blue line, a trail with a dashed line, and a steep slope through closely spaced contour lines.
Topographic symbols are useful for:
- Hiking
- Camping
- Land navigation
- Geography
- Surveying
- Outdoor recreation
- Emergency planning
- Environmental studies
- Engineering
- Land-use planning
- Military navigation
Understanding the symbols also helps you interpret relationships between different features. A trail crossing a stream near a bridge tells you much more than a simple road name would.
Natural vs. Human-Made Map Symbols
One useful way to organize topographic symbols is by the type of feature they represent.
Natural Features
Natural features are created by geological, hydrological, or biological processes.
Examples include:
- Mountains
- Hills
- Rivers
- Lakes
- Forests
- Marshes
- Cliffs
- Caves
- Springs
Human-Made Features
Human-made features are constructed or significantly modified by people.
Examples include:
- Roads
- Buildings
- Railways
- Dams
- Bridges
- Power transmission lines
- Pipelines
- Airports
- Mines
- Quarries
Being able to distinguish these two categories makes map interpretation faster.
Topographic Map Colors and Their Meanings
Colors make it easier to recognize different categories of information. However, color conventions are not identical on every map.
Always use the legend for the specific map you are reading.
Brown: Elevation and Contours
Brown commonly represents contour lines and other elevation-related information.
Contour lines show the shape and height of the land.
The spacing and shape of these lines can reveal whether terrain is flat, steep, mountainous, or valley-shaped.
Blue: Water
Blue commonly represents water features such as:
- Rivers
- Streams
- Lakes
- Ponds
- Reservoirs
- Canals
- Wetlands
Different line styles may distinguish permanent water from intermittent features.
Green: Vegetation
Green commonly indicates wooded or vegetated areas.
Depending on the map, it may identify:
- Forests
- Woodlands
- Orchards
- Vegetation areas
Vegetation information is useful for understanding land cover, although it may change over time.
Black: Cultural Features
Black is commonly used for many human-made or cultural features.
These can include:
- Buildings
- Roads
- Railroads
- Names
- Structures
- Certain boundaries
The exact use of black varies between mapping systems.
Red: Major Transportation Features
Red may be used for major roads or other significant features on some topographic maps.
Because color standards vary, the legend should be used to confirm the meaning.
Purple: Revised or Updated Information
Some mapping systems use purple for certain revised or updated information.
This is not a universal rule for every topographic map, so it should always be confirmed with the map’s legend.
What Do Contour Lines Mean?
Contour lines are among the most important topographic map symbols.
A contour line connects points that have the same elevation.
Imagine walking around a mountain while staying at exactly 1,000 feet above sea level. The path you create could be represented by a 1,000-foot contour line.
Because contour lines connect equal elevations, they allow a flat map to show three-dimensional terrain.
They can help identify:
- Hills
- Mountains
- Valleys
- Ridges
- Saddles
- Depressions
- Steep slopes
- Gentle slopes
What Is a Contour Interval?
The contour interval is the vertical difference between neighboring contour lines.
For example, if the contour interval is 20 feet and one contour is labeled 500 feet, the next contour may represent 520 feet and the next 540 feet.
The interval remains consistent within a particular map area unless the map specifies otherwise.
Knowing the contour interval is essential because it allows you to estimate elevation even when individual lines are not labeled.
What Are Index Contours?
Index contours are usually thicker and more prominent than ordinary contour lines.
They are often labeled with their elevation.
For example, an index contour might be labeled:
1,000 ft
If the contour interval is 20 feet, the thinner contours between major index contours can be interpreted from that value.
Index contours make it easier to understand elevation without labeling every single line.
What Are Intermediate Contours?
Intermediate contours are the thinner contour lines between index contours.
They provide additional information about terrain.
If you see several intermediate contours packed tightly together, the land is changing elevation quickly.
If they are spread farther apart, the slope is generally gentler.
What Are Supplementary Contours?
Some maps use supplementary contours to show smaller elevation differences, especially in relatively flat areas.
They may appear as dashed lines.
Their purpose is to provide additional terrain information where ordinary contour intervals do not show enough detail.
What Do Closely Spaced Contour Lines Mean?
Closely spaced contour lines generally indicate a steep slope.
The reason is simple: a significant elevation change occurs within a short horizontal distance.
For example, if you see many contour lines packed into a small area, you can expect the terrain to rise or fall quickly.
For hikers, this can indicate a demanding climb or descent.
What Do Widely Spaced Contour Lines Mean?
Widely spaced contour lines generally indicate a gentle slope.
The elevation changes more gradually across the landscape.
Very widely spaced contours may indicate relatively flat terrain.
However, the exact steepness depends on both the contour interval and the map scale.
How Do Topographic Maps Show Hills?
A hill is often represented by closed contour lines.
As you move toward the center, the elevation increases.
For example:
- 600 feet
- 700 feet
- 800 feet
- 900 feet
If the innermost closed contour has the highest elevation, the feature is likely a hill or peak.
A small elevation point may also provide a spot elevation that gives the measured height of a particular location.
How Do Topographic Maps Show Valleys?
Valleys are often identified by the shape of contour lines.
When contours cross a stream or drainage, they frequently form a V shape.
The point of the V generally points toward higher ground, which is often upstream.
This makes contour patterns useful for identifying the direction in which water flows.
How Do Topographic Maps Show Ridges?
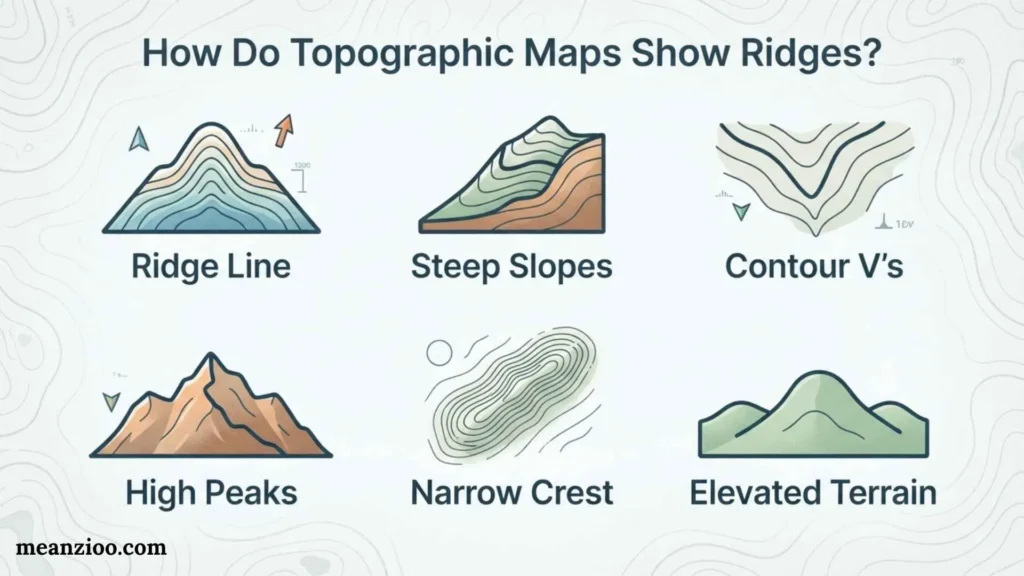
A ridge is an elongated area of high ground.
Contour lines may create elongated shapes that reveal a ridge extending away from higher terrain.
Ridges are important for navigation because they can act as recognizable landscape features and sometimes provide easier routes than steep valley walls.
How Are Depressions Shown?
A depression is an area where the ground surface drops toward the center.
On many topographic maps, closed contour lines with small inward-pointing tick marks, known as hachures, indicate depressions.
The hachures point toward the lower area.
Always check the map legend because different mapping agencies can use different conventions.
How Are Water Features Shown?
Water features are generally among the easiest symbols to recognize.
Rivers and Streams
Rivers and streams are commonly shown with blue lines.
Larger rivers may be represented by wider blue areas, while smaller streams can appear as narrow lines.
Some maps distinguish between perennial and intermittent streams.
A perennial stream normally has water throughout the year under ordinary conditions, while an intermittent stream may flow only during certain seasons or after precipitation.
Lakes and Ponds
Lakes and ponds are commonly represented by blue areas.
Their shape can also provide clues about the surrounding terrain.
Marshes and Wetlands
Wetlands may use special patterns or symbols.
These can identify marshes, swamps, bogs, or similar environments.
Such information can be valuable when planning a route because wetlands can be difficult or unsafe to cross in some conditions.
Springs
A spring is a location where groundwater reaches the surface.
Depending on the map system, springs can have a dedicated point symbol.
Road and Transportation Symbols
Transportation features are another major category of map symbols.
Highways
Major highways are generally represented more prominently than smaller roads.
The line color, width, and pattern depend on the map standard.
Secondary Roads
Smaller roads may appear as thinner lines.
Some maps distinguish paved roads, gravel roads, dirt roads, and other road types.
Trails
Hiking trails and footpaths may be represented by dashed or specialized lines.
Trail symbols can be particularly important for outdoor navigation.
However, trail conditions can change after storms, construction, fires, erosion, or maintenance changes, so a map should not always be treated as a real-time trail condition report.
Railroads
Railroads generally have distinctive symbols that differentiate them from roads.
They may use a line with repeated short marks crossing it.
Building and Structure Symbols
Topographic maps can represent many structures using small shapes or specialized symbols.
Examples include:
- Houses
- Schools
- Churches
- Hospitals
- Ranger stations
- Towers
- Tanks
- Dams
- Mines
- Campsites
The amount of building information depends on the map’s scale and purpose.
A large-scale map can show much more detail than a small-scale regional map.
Bridge Symbols
Bridges can be important navigation landmarks.
A bridge symbol can show where a road, railroad, or trail crosses a river or another obstacle.
This information is particularly useful when a route requires crossing a waterway.
Power Lines and Pipelines
Long linear infrastructure can also appear on topographic maps.
Power transmission lines are often represented using a distinctive line pattern or symbol.
Pipelines may use their own line style.
These features can be useful as navigation references because they may extend across large areas.
Boundary Symbols
Topographic maps may show several types of boundaries.
These can include:
- State boundaries
- County boundaries
- Municipal boundaries
- Park boundaries
- Forest boundaries
- Reservation boundaries
- Other administrative boundaries
Different line patterns help distinguish one type of boundary from another.
A boundary symbol should not be confused with a road or trail simply because both may use lines.
Vegetation and Land-Cover Symbols
Vegetation symbols provide information about the character of the landscape.
Maps may identify:
- Forests
- Woodlands
- Orchards
- Vineyards
- Brush
- Wetlands
- Open areas
A forested area can be important for hikers because trees can affect visibility, travel speed, and navigation.
However, vegetation data can become outdated. Forests can change because of wildfires, logging, storms, disease, construction, or natural growth.
Cliff and Rock Symbols
Topographic maps may use specialized symbols for cliffs, rock formations, exposed rock, or other rugged terrain.
Cliffs can sometimes be recognized through distinctive line patterns that indicate a sharp change in elevation.
These features are important for hikers because a route that looks short on a map may become difficult if a cliff or rocky area blocks direct travel.
Machine Feature Symbols
Topographic maps can include many human-made features beyond roads and buildings.
Examples include:
- Dams
- Levees
- Mines
- Quarries
- Airports
- Cemeteries
- Communication towers
- Power lines
- Pipelines
- Tanks
- Industrial structures
These symbols help users understand how humans have modified the landscape.
What Is a Topographic Map Legend?
The map legend, also called the map key, explains the symbols used on the map.
It is one of the most important parts of any topographic map.
The legend can explain:
- Colors
- Line styles
- Point symbols
- Road classifications
- Water features
- Vegetation
- Boundaries
- Structures
- Contour intervals
If you encounter a symbol you do not recognize, checking the legend should be your first step.
Why the Legend Is More Important Than a Generic Symbol Chart
A generic topographic map symbols chart can be useful for learning, but it cannot guarantee that a symbol has the same meaning on every map.
Different agencies can use different:
- Colors
- Line widths
- Patterns
- Abbreviations
- Feature classifications
Map readers should therefore treat generic charts as learning aids and the actual map legend as the authoritative source for that particular map.
Topographic Map Scale and Symbols
Map scale affects how features are represented.
A large-scale map covers a smaller geographic area but can show more detail.
A small-scale map covers a larger area but usually simplifies features.
For example, a narrow footpath may be visible on a detailed local map but absent from a regional map.
This is why a missing symbol does not always mean that a real-world feature does not exist.
It may simply be too small or unimportant to appear at that map scale.
Topographic Map Symbols for Hiking
Hikers often pay particular attention to:
- Contour lines
- Trails
- Roads
- Streams
- Bridges
- Springs
- Campsites
- Peaks
- Ridges
- Valleys
- Forests
- Cliffs
Contour lines help estimate how difficult a route may be.
For example, a trail crossing a large number of closely spaced contours may involve significant elevation change.
A trail following widely spaced contours may generally have a gentler slope.
Topographic Map Symbols for Navigation
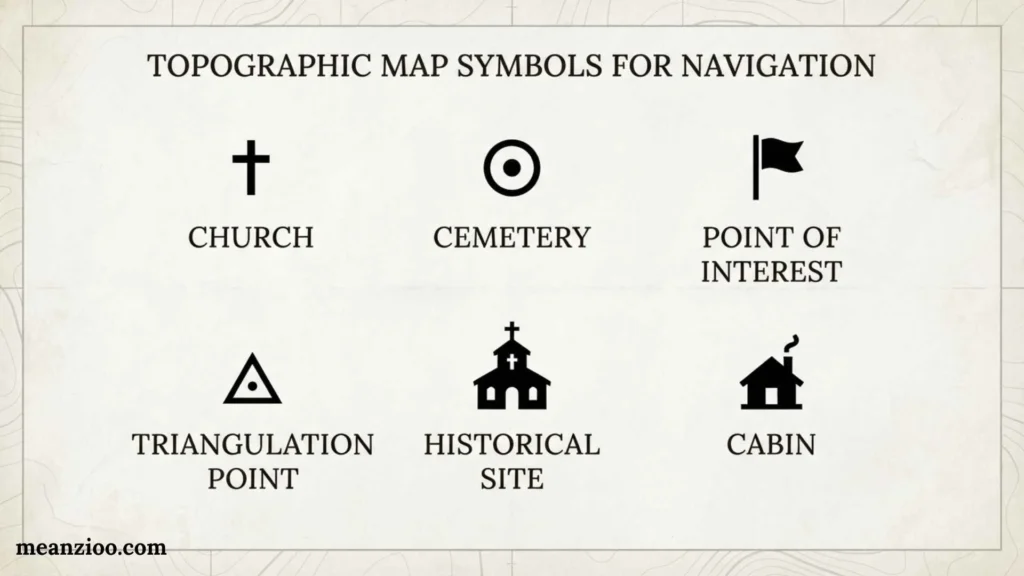
Topographic maps can provide multiple ways to identify your surroundings.
Instead of relying on one feature, compare several.
For example, you might identify:
- A river
- A nearby trail
- A road crossing the river
- A ridge north of the road
- A hill south of the trail
When these features line up with your map, you have stronger evidence that you are interpreting your location correctly.
This is sometimes called using terrain association.
How to Read Topographic Map Symbols Step by Step
Step 1: Read the Map Information
Check the map title, area, date, scale, and coordinate information.
Step 2: Study the Legend
Identify unfamiliar symbols before making assumptions.
Step 3: Find the Contour Interval
Determine the vertical difference between contour lines.
Step 4: Identify Major Water Features
Locate rivers, streams, lakes, and wetlands.
Step 5: Identify Roads and Trails
Determine the available transportation and hiking routes.
Step 6: Study Elevation
Look for hills, ridges, valleys, depressions, and steep slopes.
Step 7: Identify Important Structures
Look for bridges, towers, buildings, dams, and other landmarks.
Step 8: Combine the Information
Do not interpret symbols in isolation. Combine terrain, water, roads, vegetation, and structures to understand the whole landscape.
Common Mistakes When Reading Topographic Maps
Assuming Every Symbol Is Universal
Symbols can differ between mapping agencies.
Solution: Always check the legend.
Ignoring the Contour Interval
Looking at contour lines without knowing their interval can lead to incorrect elevation estimates.
Solution: Find the contour interval before interpreting terrain.
Thinking Close Contours Mean a High Mountain
Close contour lines indicate a steep slope, not necessarily a very high elevation.
A low hill can have steep sides, while a high mountain can have relatively gentle slopes.
Treating a Trail as a Guarantee of Current Access
A mapped trail may have changed since the map was produced.
Solution: Check current trail and land-management information when planning an actual trip.
Confusing Map Scale
A feature that is absent from a map may still exist in the real world.
Solution: Consider whether the map’s scale allows the feature to be shown.
Topographic Map Symbols vs. Political Map Symbols
| Feature | Topographic Map | Political Map |
| Elevation | Detailed | Usually limited |
| Contour lines | Common | Usually absent |
| Terrain | Detailed | Limited |
| Roads | Often detailed | May be simplified |
| Rivers and lakes | Detailed | Often shown |
| Political boundaries | May be included | Major focus |
| Buildings | Sometimes included | Usually limited |
| Hiking trails | Often shown on detailed maps | Usually absent |
A topographic map focuses primarily on terrain and physical features, while a political map focuses on administrative boundaries and places.
Frequently Asked Questions About Topographic Map Symbols
What are topographic map symbols?
Topographic map symbols are standardized or conventional graphic signs used to represent natural and human-made features such as elevation, roads, rivers, buildings, vegetation, and boundaries.
What are the main colors used on topographic maps?
Common colors include brown for contour and elevation information, blue for water, green for vegetation, black for many cultural features, and red for certain major features. Exact meanings depend on the mapping system.
What does brown mean on a topographic map?
Brown commonly represents contour lines and elevation-related information.
What does blue mean on a topographic map?
Blue commonly represents water features such as rivers, streams, lakes, ponds, and wetlands.
What does green mean on a topographic map?
Green commonly indicates vegetation or wooded areas.
What do black symbols mean on a topographic map?
Black can represent many cultural or human-made features, including buildings, roads, railroads, labels, and other structures.
What do closely spaced contour lines indicate?
Closely spaced contour lines generally indicate a steep slope because elevation changes rapidly over a short horizontal distance.
What do widely spaced contour lines indicate?
Widely spaced contour lines generally indicate a gentler slope.
What is an index contour?
An index contour is a prominent contour line, commonly thicker and labeled with its elevation. It helps users determine the elevation of nearby contour lines.
What is a contour interval?
A contour interval is the vertical elevation difference between adjacent contour lines.
How do you identify a hill on a topographic map?
A hill is often shown by closed contour lines with increasing elevations toward the center.
How do you identify a valley?
A valley can often be identified by contour lines forming V-shaped patterns around a drainage. The V generally points toward higher ground.
What is the most important part of a topographic map?
There is no single part that works independently. The legend, scale, contour interval, and contour patterns are all essential for accurate interpretation.
Why do topographic map symbols vary?
Different countries, agencies, map series, scales, and publication standards can use different symbols and colors. The specific map legend should always be used as the final reference.
Final Thoughts
Topographic map symbols provide a practical visual language for understanding the Earth’s surface. Contour lines reveal elevation and terrain shape, blue symbols identify water, green commonly shows vegetation, and lines and icons represent roads, trails, buildings, boundaries, and other features.
The key to reading a topographic map is not memorizing every symbol at once. Start with the legend, scale, contour interval, colors, and major terrain features, then gradually learn more specialized symbols.
Most importantly, avoid assuming that every symbol has exactly the same meaning on every map. Mapping standards differ, and the legend for the specific map you are using is the most reliable source. Once you combine the symbols together, a flat sheet of paper becomes a detailed picture of the landscape and can provide valuable information for navigation, geography, hiking, planning, and education.

I’m Ryan Mitchell, and I write about modern English, trending slang, and online expressions. I enjoy explaining the meanings, origins, and real-life usage of popular words in a simple way. I believe learning slang is an important step toward understanding today’s English-speaking culture. Through my work, I aim to help readers speak more naturally and stay updated with the latest language trends.
 Charlotte Hayes